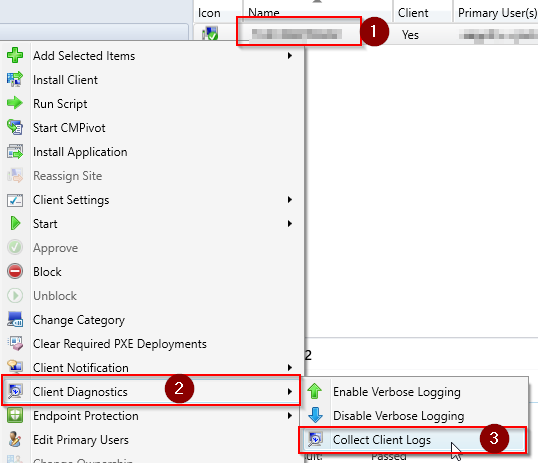
Have you ever wanted to look at MECM client logs for a remote system? If your organization follows security best practices, it can be a challenge just to navigate to the C$ share on a system and access the CCM logs folder. Check out the little-known Client Diagnostics > Collect Client Logs right click option in the MECM console. It will use the Client Notification fast channel (near real-time) in MECM to collect the contents of %windir%\ccm\logs along with some basic diagnostic data about the system. The MECM client zips up the logs and diagnostic data and sends it to the MP. To view the logs you just have to right click on the device, go to Start, and click on Resource Explorer. The Diagnostic Files section of Resource Explorer will show any recent log/diagnostic collection data.
Collecting Client Diagnostics & Logs
Open the MECM console and go to Assets and Compliance\Overview\Devices. Right click on a Device (1), go to Client Diagnostics (2), and click on Collect Client Logs (3). This will send a notification to the client using the Client Notification channel, MECM’s fast / real-time way of communicating with the client. If the Management Point (MP) is unable to reach the client (bad DNS, firewall, etc), the client should still check in with the MP at least once every 15 minutes at which point the MP would request the diagnostics. You won’t get a notification when the data has been collected. You can either just wait a short time to check for logs or you can watch for this to occur on the MP log folder in MP_SinvCollFile.log or on the Site Server log folder in Sinvproc.log.
Viewing Client Diagnostics & Logs
Right click on the Device (4), go to Start (5), and click on Resource Explorer (6).
In Resource Explorer, click on Diagnostic Files (7) in the navigation pane. If you have collected diagnostics on the client more than once, you’ll see each time with a “Collection Date” stamped on it. While the server logs mentioned above will tell you exactly when the data is available, you can also just look to see if it’s there and F5/refresh if it isn’t. Once you see something with the collection date/time you’re looking for, right click on the data you want to see (8) and click on Open Support Center (9).
* You can also click on Save to save the Zip file containing all of the data and logs to your computer. This can be an especially handy feature if you want your Service Desk team to collect diagnostic data and attach it to a ticket for escalation.
Support Center will automatically unzip the log data and show you a list of client logs (may have to select the Logs tab on the top of the window) that it collected. Double click on a log (10) and it will open using OneTrace, CMTrace’s younger and more sophisticated sibling. If you’re troubleshooting an application deployment, your best friends will be CAS.log for monitoring content distribution and AppEnforce.log for monitoring Application installations.
You can also see other key configuration diagnostics on the client. The Configuration tab shows information on the MECM client, the Operating System, the Computer, services running at the time of data collection, and Network Adapter information at the time of data collection. If you’re trying to troubleshoot content distribution issues for example, you might look at the collected CAS.log and see that a client was trying to get content from a Distribution Point you wouldn’t expect. You can then look at the Network Adapter information here and see what the IP address was at the time the data was collected. This would give you the information you need to verify that your boundaries and boundary groups were configured properly.


Comments
Post a Comment